Vanken opens pcap and pcapng captures, lets you inspect packets and their bytes, and captures live traffic on Linux and macOS. This walkthrough starts with a capture file, which needs no capture privileges.
Install and launch
You need Ruby 3.3 or newer. Ruby 3.4 or 4.0 with YJIT is recommended; Vanken enables YJIT when it is available.
-
Linux: use a desktop session with Vulkan loader/drivers, fonts, and
zenityfor file dialogs. On Ubuntu, install them with the command below. -
macOS: use the native desktop application or the terminal UI.
-
Windows: inspect capture files. Live capture is supported on Linux and macOS.
sudo apt install libvulkan1 mesa-vulkan-drivers fonts-dejavu-core fonts-noto-cjk zenity
Install the gem, then launch Vanken as your normal user:
gem install vanken
vanken
You can also open a file directly:
vanken capture.pcapng
Replace capture.pcapng with the path to your capture. Quote paths that contain spaces. For a source checkout, use bundle install and run bundle exec exe/vanken from the repository directory.
The steps below use English labels. If the application starts in Japanese, open Preferences with Ctrl+Shift+P, then change Language to English in the appearance tab. The native macOS window uses Command instead of Ctrl; the terminal UI uses Ctrl on every platform.
Open and inspect your first packet
-
Choose Open in the toolbar or File menu and select a
.pcapor.pcapngfile. You can also choose a recent file or drop a capture onto the window. -
Select a row in the packet list. Its protocol tree appears in Packet details, and its hexadecimal and text bytes appear in Packet bytes.
-
Expand a protocol, such as IPv4 or TCP, and select a field. Vanken highlights the corresponding captured bytes. Selecting bytes finds the smallest matching field in the tree.
-
Drag the split dividers to make more room for details or bytes. Your split positions are saved.
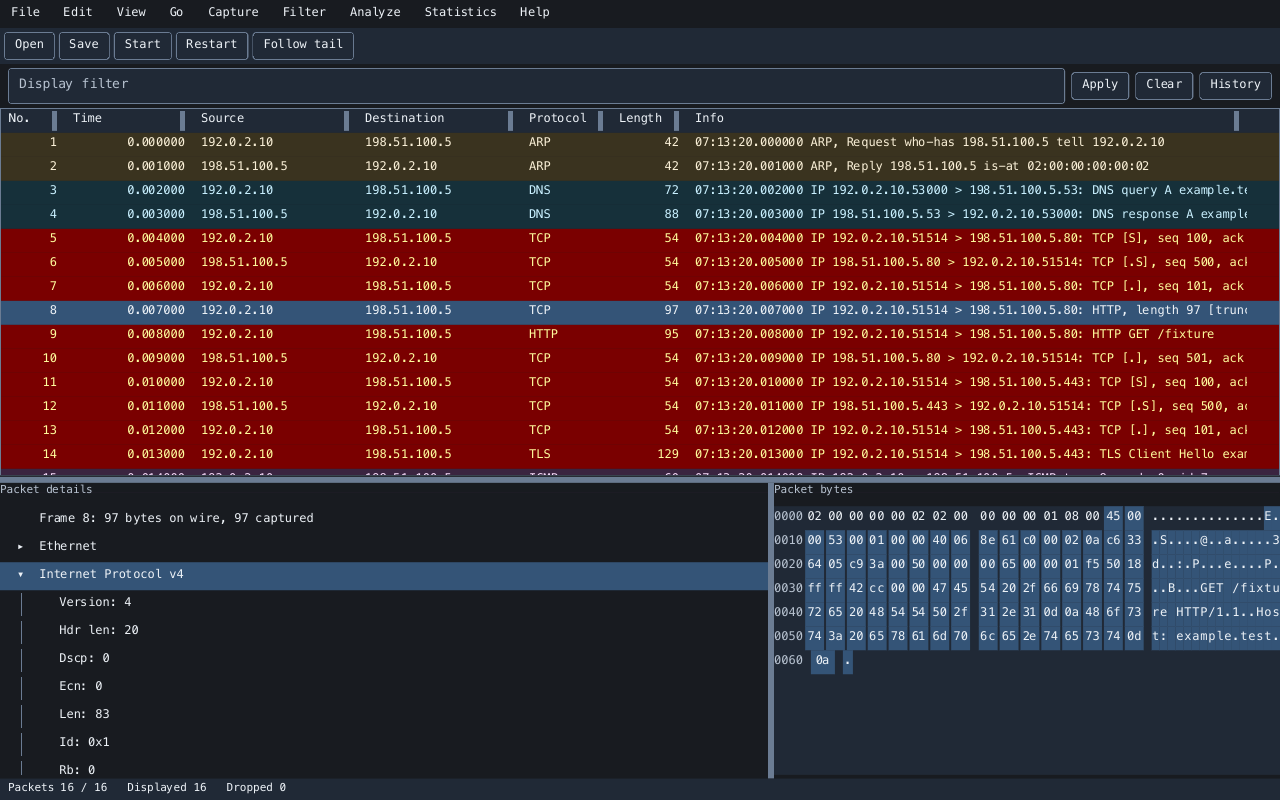 showing a packet list, an expanded protocol tree, and linked packet bytes
Large files appear progressively while analysis continues. The status bar separates analyzed packets from the number already retained; selecting a row loads its details in the background.
Narrow the packet list
Enter a Vanken display filter in the field below the toolbar, then choose Apply or press Enter while the field has focus:
tcp
To narrow it further, try:
tcp.port == 443
That example shows TCP packets whose source or destination port is 443. A valid filter may show no rows when the capture contains no matching traffic. Choose Clear to show all analyzed packets again. Filtering keeps the original capture bytes.
You can also select a field in Packet details and use its context menu to apply its value as a filter. Prepare filter puts the expression in the input so you can edit it before applying it. See the display filter reference for addresses, strings, repeated fields, and operators.
Save a capture or export a subset
Choose Save as from the File menu, or press Ctrl+Shift+S. Use a .pcapng filename to preserve interface metadata. Saving includes all retained packets, including packets that are still awaiting analysis.
To save only the packets that match your filter, use File → Export specified packets, choose Displayed as the target, select pcapng, and choose Export. The user guide explains selected, marked, and numbered ranges, plus JSON, NDJSON, text, and CSV exports.
Start a live capture
Live capture needs access to the network capture device. Follow the capture permissions guide for your operating system before your first capture. Keep Vanken running as your normal user; the helper handles capture permissions separately.
-
Choose Start in the toolbar, or select an interface on the welcome screen.
-
Pick the interface carrying the traffic you want to inspect. Leave the capture filter empty for an initial capture, or enter a BPF filter such as
tcp port 443. -
Choose Start in Capture options. Generate the traffic you want to observe, then choose Stop.
-
Inspect and filter the retained packets, then use Save as to keep the capture.
Capture filters use BPF, such as tcp port 443. Display filters use Vanken’s separate language, such as tcp.port == 443. A capture filter limits what is acquired; a display filter changes which acquired packets you see.
If opening another file or quitting would discard an unsaved capture, Vanken offers Save, Discard, or Cancel. Stopping capture keeps its packets available for inspection.
Work from a terminal
Open the interactive terminal UI with:
vanken --tui capture.pcapng
Use Tab and Shift+Tab to move between controls. Ctrl+Shift+K opens the command palette, where you can search for an action and press Enter to run it. See keyboard and terminal operation for shortcuts and terminal limitations.
For tab-separated output without an interactive window:
vanken --headless --read capture.pcapng --print-columns --filter 'frame.number <= 10'
This prints the standard column header and the first ten packet numbers, or fewer for a smaller capture. Run vanken --help for the available command-line options.
Continue with the user guide for searching, stream reconstruction, statistics, custom columns, profiles, and recovery. See performance and limits for handling large or busy captures.